KN 构建速度体检
profile构建耗时方式
KN构建过程中的任务份三个维度:
- gradle task:最粗的维度,其中 compileKotlin 是调 konan 前端的gradle任务,linkDebugSharedOhosArm64/linkPodDebugFrameworkIosArm64 是调 konan 后端的gradle任务
- konan phase:konan执行过程中内部的步骤,如 TODO
- llvm pass:release build 下主要的耗时在 LLVM IR上的 Module 和 LTO 两个 LLVM 优化管线,pass是管线中的步骤
gradle任务
有两种方式:–profile –scan
- –profile:
./gradlew linkReleaseSharedOhosArm64 --profile。不会上报数据到服务器,会生成一份本地的html报告。其中 UP-TO-DATE 代表任务的输入没变没被执行;FROM-CACHE 代表任务的输入变了,但是gradle前面有缓存过这个输入对应的输出,直接使用了缓存;SKIPPED表示不满足执行条件没有执行;任务后面如果是空的说明任务重新执行了。可以用来查看任务的执行情况和具体任务的耗时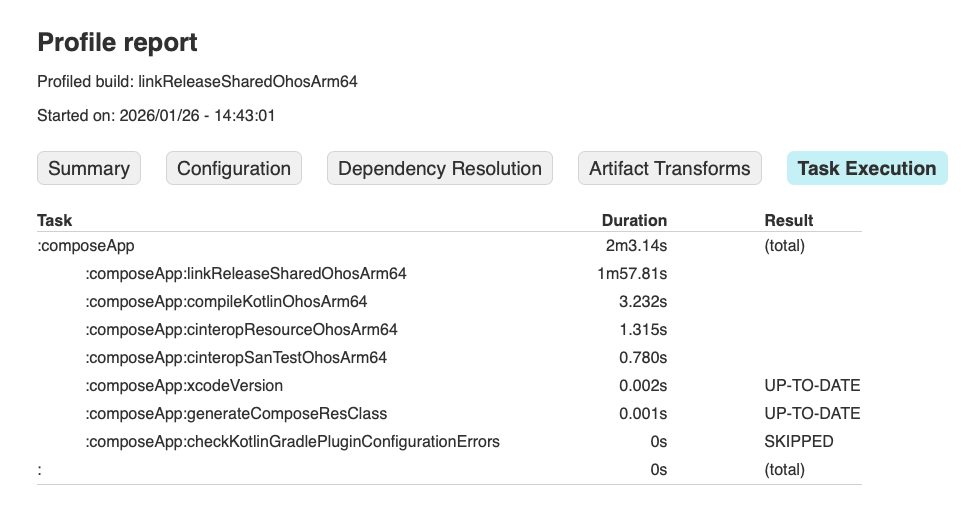
- –scan:比 –profile 收集的信息更多,包括依赖版本,并行时间线,任务依赖关系等。但是会上传数据到develocity
konan phase
freeCompilerArgs 添加 -Xprofile-phases,命令行会输出类似 Inline class property accessors: 1 msec 具体 konan phase 耗时的信息,这些phase主要是对kotlin ir进行转换和优化。一些 phase 在 kt 文件范围执行会跑很多次,可以使用脚本统计总耗时。通常优化相关的phase耗时较长
1
2
3
4
5
6
7
8
9
10
11
12
13
14
15
16
17
18
19
20
21
22
23
24
25
26
27
28
29
30
31
32
33
34
35
36
37
38
39
40
41
42
43
44
45
46
47
48
49
50
51
52
53
54
55
56
57
58
59
60
61
62
63
64
65
66
67
68
69
70
71
72
73
74
75
76
77
78
79
80
81
82
83
84
85
86
87
88
89
90
91
92
93
94
95
96
97
98
99
100
101
102
103
104
105
106
107
108
109
110
111
112
113
114
115
116
117
118
119
120
121
122
123
124
125
126
127
128
129
130
131
132
133
134
135
136
137
138
139
140
141
#!/usr/bin/env python3
"""
Parse Kotlin Native build log and extract phase timing statistics.
"""

import re
import sys
import csv
from collections import defaultdict


def parse_build_log(log_file_path):
    """
    Parse build log file and extract phase timing information.

    Args:
        log_file_path: Path to the build log file

    Returns:
        Tuple of (phase_times dict, phase_order list)
        phase_times: Dictionary mapping phase names to list of elapsed times (in order)
        phase_order: List of phase names in the order they first appeared
    """
    phase_times = defaultdict(list)
    phase_order = []

    # Pattern to match lines ending with ": xxx msec"
    pattern = re.compile(r'^(.+?):\s+(\d+)\s+msec$')

    try:
        with open(log_file_path, 'r', encoding='utf-8') as f:
            for line in f:
                line = line.strip()
                match = pattern.match(line)
                if match:
                    phase_name = match.group(1).strip()
                    elapsed_time = int(match.group(2))
                    phase_times[phase_name].append(elapsed_time)
                    # Track order of first appearance
                    if phase_name not in phase_order:
                        phase_order.append(phase_name)
    except FileNotFoundError:
        print(f"Error: File '{log_file_path}' not found.", file=sys.stderr)
        sys.exit(1)
    except Exception as e:
        print(f"Error reading file: {e}", file=sys.stderr)
        sys.exit(1)

    return phase_times, phase_order


def calculate_statistics(phase_times, phase_order):
    """
    Calculate statistics for each phase.

    Args:
        phase_times: Dictionary mapping phase names to list of elapsed times
        phase_order: List of phase names in the order they first appeared

    Returns:
        List of dictionaries containing phase statistics
    """
    results = []

    # Process phases in the order they first appeared in the log (not sorted)
    for phase_name in phase_order:
        times = phase_times[phase_name]
        count = len(times)
        total = sum(times)
        average = total / count if count > 0 else -1
        max_time = max(times) if times else -1
        min_time = min(times) if times else -1

        # Format elapsed times as comma-separated string
        elapsed_times_str = ', '.join(str(t) for t in times)

        results.append({
            'Phase Name': phase_name,
            'Count': count,
            'Total (msec)': total,
            'Average (msec)': round(average, 2) if average >= 0 else -1,
            'Max (msec)': max_time if max_time >= 0 else -1,
            'Min (msec)': min_time if min_time >= 0 else -1,
            'Elapsed Times (msec)': elapsed_times_str
        })

    return results


def write_csv(results, output_file):
    """
    Write results to CSV file.

    Args:
        results: List of dictionaries containing phase statistics
        output_file: Path to output CSV file
    """
    if not results:
        print("No phase timing data found.", file=sys.stderr)
        return

    fieldnames = ['Phase Name', 'Count', 'Total (msec)', 'Average (msec)', 'Max (msec)', 'Min (msec)', 'Elapsed Times (msec)']

    try:
        with open(output_file, 'w', newline='', encoding='utf-8') as f:
            writer = csv.DictWriter(f, fieldnames=fieldnames)
            writer.writeheader()
            writer.writerows(results)
        print(f"Results written to '{output_file}'")
    except Exception as e:
        print(f"Error writing CSV file: {e}", file=sys.stderr)
        sys.exit(1)


def main():
    if len(sys.argv) < 2:
        print("Usage: python parse_build_log.py <log_file>", file=sys.stderr)
        print("Example: python parse_build_log.py build.log", file=sys.stderr)
        sys.exit(1)

    log_file = sys.argv[1]
    output_file = 'build_stats.csv'

    print(f"Parsing build log: {log_file}")
    phase_times, phase_order = parse_build_log(log_file)

    if not phase_times:
        print("No phase timing data found in the log file. Make konan output it by adding freeCompilerArgs += '-Xprofile-phases' to your build.gradle.kts", file=sys.stderr)
        sys.exit(1)

    print(f"Found {len(phase_times)} unique phases")
    results = calculate_statistics(phase_times, phase_order)
    write_csv(results, output_file)

    # Print summary
    total_phases = sum(len(times) for times in phase_times.values())
    print(f"Total phase executions: {total_phases}")


if __name__ == '__main__':
    main()
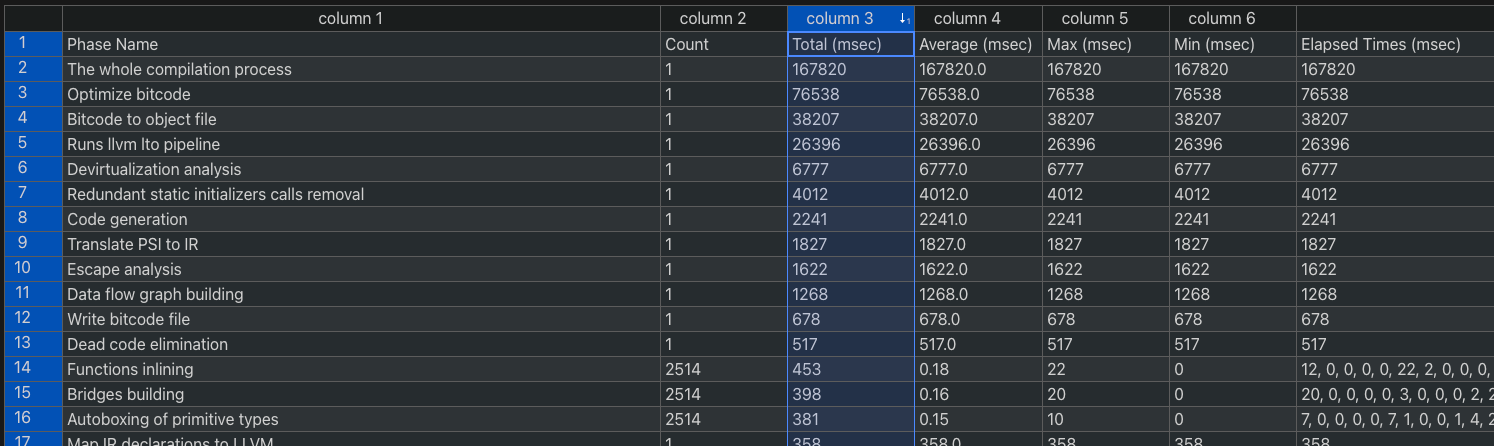
脚本的输出默认按phase第一次在log中出现的顺序,demo项目上按总耗时排序的效果。The whole compilation process是构建总耗时,一些phase有大量的
LLVM Pass
kotlin的设计本意是开启 -Xprofile-phases 后同时打印 konan phase 和 llvm pass的耗时,但是直到 2.3.0 版本 llvm pass的耗时打印都是有问题的需要patch kotlin才能看到耗时,2.3以前的版本需要patch。
修改参考:https://github.com/linhandev/KuiklyBase-kotlin/commit/cc06373a51a1776d699f11778a93c4c5f1e153af 之后添加 -Xprofile-phases 选项后在运行 ./gradlew 命令时所在的目录会看到LLVM管线中pass的耗时结果文件,文件名是phase名。
部分phase,如 Mandatory llvm optimizations 使用了带耗时统计功能的phase实现但是实际没有调用任何 llvm 的 pass,输出为空,正常的管线耗时统计,如一个 demo 的 LTO LLVM optimizations 管线耗时。这个profile结果提示深入研究为什么 Global Variable Optimizer #3 pass耗时占比这么高
1
2
3
4
5
6
7
8
9
10
11
12
13
14
15
16
17
18
19
20
21
22
23
24
25
26
27
28
29
30
31
32
33
34
35
36
37
38
39
40
41
42
43
44
45
46
47
48
49
50
51
52
53
54
55
56
57
58
59
60
61
62
63
64
65
66
67
68
69
70
71
72
73
74
75
76
77
78
79
80
81
82
83
84
85
86
87
88
89
90
91
92
93
94
95
96
97
98
99
100
101
102
103
104
105
106
107
108
109
110
111
112
113
114
115
116
117
118
119
120
121
122
123
124
125
126
127
128
129
130
131
132
133
134
135
136
137
138
139
140
141
142
143
144
145
146
147
148
149
150
151
152
153
154
155
156
157
158
159
160
161
162
163
164
165
166
167
168
169
170
171
===-------------------------------------------------------------------------===
                      ... Pass execution timing report ...
===-------------------------------------------------------------------------===
  Total Execution Time: 22.8407 seconds (22.7992 wall clock)

   ---User Time---   --System Time--   --User+System--   ---Wall Time---  --- Name ---
   8.9703 ( 46.4%)   0.1522 (  4.4%)   9.1226 ( 39.9%)   9.1070 ( 39.9%)  Global Variable Optimizer #3
   0.9846 (  5.1%)   0.0328 (  0.9%)   1.0174 (  4.5%)   1.0161 (  4.5%)  Global Value Numbering #2
   0.6931 (  3.6%)   0.0535 (  1.5%)   0.7466 (  3.3%)   0.7451 (  3.3%)  Interprocedural Sparse Conditional Constant Propagation #2
   0.6777 (  3.5%)   0.0283 (  0.8%)   0.7061 (  3.1%)   0.7048 (  3.1%)  Combine redundant instructions #8
   0.6909 (  3.6%)   0.0101 (  0.3%)   0.7010 (  3.1%)   0.6996 (  3.1%)  Called Value Propagation #2
   0.6697 (  3.5%)   0.0299 (  0.9%)   0.6995 (  3.1%)   0.6988 (  3.1%)  Combine redundant instructions #9
   0.6354 (  3.3%)   0.0066 (  0.2%)   0.6420 (  2.8%)   0.6406 (  2.8%)  Global Variable Optimizer #4
   0.5284 (  2.7%)   0.0314 (  0.9%)   0.5598 (  2.5%)   0.5587 (  2.5%)  Combine redundant instructions #7
   0.4964 (  2.6%)   0.0294 (  0.8%)   0.5258 (  2.3%)   0.5244 (  2.3%)  Combine redundant instructions #10
   0.4746 (  2.5%)   0.0322 (  0.9%)   0.5068 (  2.2%)   0.5050 (  2.2%)  Function Integration/Inlining #2
   0.4761 (  2.5%)   0.0292 (  0.8%)   0.5053 (  2.2%)   0.5039 (  2.2%)  Combine redundant instructions #11
   0.3981 (  2.1%)   0.0289 (  0.8%)   0.4270 (  1.9%)   0.4262 (  1.9%)  Dead Store Elimination #2
   0.3606 (  1.9%)   0.0282 (  0.8%)   0.3888 (  1.7%)   0.3883 (  1.7%)  Memory SSA #5
   0.2146 (  1.1%)   0.0281 (  0.8%)   0.2426 (  1.1%)   0.2417 (  1.1%)  Sparse Conditional Constant Propagation #2
   0.1555 (  0.8%)   0.0273 (  0.8%)   0.1828 (  0.8%)   0.1826 (  0.8%)  Bit-Tracking Dead Code Elimination #2
   0.1206 (  0.6%)   0.0315 (  0.9%)   0.1521 (  0.7%)   0.1515 (  0.7%)  Deduce function attributes #2
   0.1438 (  0.7%)   0.0010 (  0.0%)   0.1449 (  0.6%)   0.1440 (  0.6%)  Dead Global Elimination #3
   0.1121 (  0.6%)   0.0268 (  0.8%)   0.1389 (  0.6%)   0.1385 (  0.6%)  Deduce function attributes #3
   0.0919 (  0.5%)   0.0269 (  0.8%)   0.1188 (  0.5%)   0.1187 (  0.5%)  Simplify the CFG #9
   0.0908 (  0.5%)   0.0265 (  0.8%)   0.1174 (  0.5%)   0.1172 (  0.5%)  Jump Threading #4
   0.0882 (  0.5%)   0.0263 (  0.8%)   0.1145 (  0.5%)   0.1143 (  0.5%)  Jump Threading #3
   0.0868 (  0.4%)   0.0260 (  0.7%)   0.1128 (  0.5%)   0.1124 (  0.5%)  Simplify the CFG #10
   0.0975 (  0.5%)   0.0062 (  0.2%)   0.1038 (  0.5%)   0.1035 (  0.5%)  Induction Variable Simplification #2
   0.0744 (  0.4%)   0.0267 (  0.8%)   0.1011 (  0.4%)   0.1009 (  0.4%)  MemCpy Optimization #2
   0.0678 (  0.4%)   0.0267 (  0.8%)   0.0945 (  0.4%)   0.0941 (  0.4%)  Optimize scalar/vector ops #2
   0.0629 (  0.3%)   0.0263 (  0.8%)   0.0892 (  0.4%)   0.0891 (  0.4%)  Branch Probability Analysis #8
   0.0714 (  0.4%)   0.0059 (  0.2%)   0.0773 (  0.3%)   0.0772 (  0.3%)  Loop Invariant Code Motion #4
   0.0485 (  0.3%)   0.0262 (  0.7%)   0.0747 (  0.3%)   0.0746 (  0.3%)  Post-Dominator Tree Construction #9
   0.0448 (  0.2%)   0.0265 (  0.8%)   0.0713 (  0.3%)   0.0712 (  0.3%)  Dominator Tree Construction #7
   0.0447 (  0.2%)   0.0265 (  0.8%)   0.0712 (  0.3%)   0.0712 (  0.3%)  Block Frequency Analysis #9
   0.0385 (  0.2%)   0.0311 (  0.9%)   0.0696 (  0.3%)   0.0694 (  0.3%)  Call-site splitting #2
   0.0392 (  0.2%)   0.0302 (  0.9%)   0.0694 (  0.3%)   0.0693 (  0.3%)  Dominator Tree Construction #10
   0.0381 (  0.2%)   0.0310 (  0.9%)   0.0692 (  0.3%)   0.0691 (  0.3%)  Dominator Tree Construction #16
   0.0419 (  0.2%)   0.0259 (  0.7%)   0.0678 (  0.3%)   0.0679 (  0.3%)  Tail Call Elimination #2
   0.0382 (  0.2%)   0.0295 (  0.8%)   0.0677 (  0.3%)   0.0677 (  0.3%)  Dominator Tree Construction #12
   0.0377 (  0.2%)   0.0299 (  0.9%)   0.0676 (  0.3%)   0.0676 (  0.3%)  Combine pattern based expressions #2
   0.0241 (  0.1%)   0.0395 (  1.1%)   0.0636 (  0.3%)   0.0630 (  0.3%)  Natural Loop Information #19
   0.0362 (  0.2%)   0.0262 (  0.7%)   0.0624 (  0.3%)   0.0621 (  0.3%)  Post-Dominator Tree Construction #10
   0.0359 (  0.2%)   0.0261 (  0.7%)   0.0619 (  0.3%)   0.0620 (  0.3%)  Dominator Tree Construction #8
   0.0615 (  0.3%)   0.0005 (  0.0%)   0.0620 (  0.3%)   0.0619 (  0.3%)  Dead Global Elimination #4
   0.0582 (  0.3%)   0.0023 (  0.1%)   0.0606 (  0.3%)   0.0604 (  0.3%)  Dead Global Elimination #5
   0.0314 (  0.2%)   0.0266 (  0.8%)   0.0580 (  0.3%)   0.0577 (  0.3%)  Dominator Tree Construction #6
   0.0501 (  0.3%)   0.0055 (  0.2%)   0.0556 (  0.2%)   0.0555 (  0.2%)  CallGraph Construction #5
   0.0548 (  0.3%)   0.0006 (  0.0%)   0.0555 (  0.2%)   0.0553 (  0.2%)  SROA #3
   0.0541 (  0.3%)   0.0007 (  0.0%)   0.0548 (  0.2%)   0.0548 (  0.2%)  CallGraph Construction #4
   0.0343 (  0.2%)   0.0194 (  0.6%)   0.0537 (  0.2%)   0.0537 (  0.2%)  Dominator Tree Construction #15
   0.0513 (  0.3%)   0.0005 (  0.0%)   0.0518 (  0.2%)   0.0517 (  0.2%)  CallGraph Construction #6
   0.0513 (  0.3%)   0.0002 (  0.0%)   0.0514 (  0.2%)   0.0512 (  0.2%)  CallGraph Construction #7
   0.0202 (  0.1%)   0.0297 (  0.8%)   0.0499 (  0.2%)   0.0498 (  0.2%)  Remove unused exception handling info #2
   0.0199 (  0.1%)   0.0295 (  0.8%)   0.0494 (  0.2%)   0.0494 (  0.2%)  Natural Loop Information #15
   0.0232 (  0.1%)   0.0262 (  0.7%)   0.0494 (  0.2%)   0.0492 (  0.2%)  Loop Vectorization #2
   0.0190 (  0.1%)   0.0302 (  0.9%)   0.0493 (  0.2%)   0.0491 (  0.2%)  Promote Memory to Register #2
   0.0207 (  0.1%)   0.0261 (  0.7%)   0.0468 (  0.2%)   0.0468 (  0.2%)  Natural Loop Information #20
   0.0201 (  0.1%)   0.0257 (  0.7%)   0.0458 (  0.2%)   0.0457 (  0.2%)  Natural Loop Information #17
   0.0173 (  0.1%)   0.0264 (  0.8%)   0.0436 (  0.2%)   0.0435 (  0.2%)  Inject TLI Mappings #2
   0.0163 (  0.1%)   0.0272 (  0.8%)   0.0434 (  0.2%)   0.0434 (  0.2%)  Promote 'by reference' arguments to scalars #2
   0.0168 (  0.1%)   0.0258 (  0.7%)   0.0427 (  0.2%)   0.0425 (  0.2%)  Natural Loop Information #18
   0.0161 (  0.1%)   0.0260 (  0.7%)   0.0421 (  0.2%)   0.0420 (  0.2%)  SROA #4
   0.0153 (  0.1%)   0.0263 (  0.8%)   0.0416 (  0.2%)   0.0414 (  0.2%)  Scalar Evolution Analysis #11
   0.0299 (  0.2%)   0.0110 (  0.3%)   0.0410 (  0.2%)   0.0408 (  0.2%)  Branch Probability Analysis #6
   0.0351 (  0.2%)   0.0058 (  0.2%)   0.0409 (  0.2%)   0.0408 (  0.2%)  Unroll loops #4
   0.0399 (  0.2%)   0.0003 (  0.0%)   0.0402 (  0.2%)   0.0401 (  0.2%)  PGOIndirectCallPromotion
   0.0126 (  0.1%)   0.0265 (  0.8%)   0.0391 (  0.2%)   0.0390 (  0.2%)  Scalar Evolution Analysis #14
   0.0126 (  0.1%)   0.0263 (  0.8%)   0.0389 (  0.2%)   0.0389 (  0.2%)  Canonicalize natural loops #9
   0.0085 (  0.0%)   0.0298 (  0.9%)   0.0383 (  0.2%)   0.0383 (  0.2%)  Basic Alias Analysis (stateless AA impl) #15
   0.0120 (  0.1%)   0.0261 (  0.7%)   0.0381 (  0.2%)   0.0380 (  0.2%)  Scalar Evolution Analysis #13
   0.0117 (  0.1%)   0.0262 (  0.7%)   0.0379 (  0.2%)   0.0380 (  0.2%)  Scalar Evolution Analysis #12
   0.0118 (  0.1%)   0.0263 (  0.8%)   0.0382 (  0.2%)   0.0380 (  0.2%)  Scalar Evolution Analysis #10
   0.0082 (  0.0%)   0.0298 (  0.9%)   0.0379 (  0.2%)   0.0379 (  0.2%)  Function Alias Analysis Results #21
   0.0112 (  0.1%)   0.0262 (  0.7%)   0.0373 (  0.2%)   0.0371 (  0.2%)  Lazy Value Information Analysis #4
   0.0142 (  0.1%)   0.0218 (  0.6%)   0.0359 (  0.2%)   0.0369 (  0.2%)  Dominator Tree Construction #13
   0.0104 (  0.1%)   0.0263 (  0.8%)   0.0366 (  0.2%)   0.0367 (  0.2%)  Memory Dependence Analysis #2
   0.0101 (  0.1%)   0.0260 (  0.7%)   0.0360 (  0.2%)   0.0360 (  0.2%)  Lazy Value Information Analysis #3
   0.0095 (  0.0%)   0.0261 (  0.7%)   0.0356 (  0.2%)   0.0357 (  0.2%)  Loop-Closed SSA Form Pass #8
   0.0087 (  0.0%)   0.0261 (  0.7%)   0.0348 (  0.2%)   0.0349 (  0.2%)  Function Alias Analysis Results #31
   0.0050 (  0.0%)   0.0298 (  0.9%)   0.0348 (  0.2%)   0.0348 (  0.2%)  Lazy Branch Probability Analysis #19
   0.0084 (  0.0%)   0.0261 (  0.7%)   0.0345 (  0.2%)   0.0346 (  0.2%)  Function Alias Analysis Results #25
   0.0085 (  0.0%)   0.0260 (  0.7%)   0.0345 (  0.2%)   0.0345 (  0.2%)  Function Alias Analysis Results #30
   0.0086 (  0.0%)   0.0262 (  0.7%)   0.0348 (  0.2%)   0.0344 (  0.2%)  Function Alias Analysis Results #26
   0.0081 (  0.0%)   0.0262 (  0.8%)   0.0343 (  0.2%)   0.0342 (  0.2%)  Loop-Closed SSA Form Pass #9
   0.0080 (  0.0%)   0.0264 (  0.8%)   0.0343 (  0.2%)   0.0342 (  0.2%)  Function Alias Analysis Results #29
   0.0080 (  0.0%)   0.0261 (  0.7%)   0.0341 (  0.1%)   0.0341 (  0.1%)  Basic Alias Analysis (stateless AA impl) #18
   0.0081 (  0.0%)   0.0260 (  0.7%)   0.0342 (  0.1%)   0.0340 (  0.1%)  Function Alias Analysis Results #24
   0.0078 (  0.0%)   0.0261 (  0.7%)   0.0339 (  0.1%)   0.0339 (  0.1%)  Function Alias Analysis Results #27
   0.0080 (  0.0%)   0.0260 (  0.7%)   0.0340 (  0.1%)   0.0338 (  0.1%)  Function Alias Analysis Results #28
   0.0037 (  0.0%)   0.0298 (  0.9%)   0.0336 (  0.1%)   0.0335 (  0.1%)  Optimization Remark Emitter #16
   0.0073 (  0.0%)   0.0260 (  0.7%)   0.0332 (  0.1%)   0.0332 (  0.1%)  Function Alias Analysis Results #23
   0.0035 (  0.0%)   0.0296 (  0.8%)   0.0332 (  0.1%)   0.0331 (  0.1%)  Lazy Block Frequency Analysis #19
   0.0033 (  0.0%)   0.0297 (  0.8%)   0.0329 (  0.1%)   0.0330 (  0.1%)  OpenMP specific optimizations #2
   0.0070 (  0.0%)   0.0258 (  0.7%)   0.0327 (  0.1%)   0.0327 (  0.1%)  Function Alias Analysis Results #22
   0.0063 (  0.0%)   0.0262 (  0.7%)   0.0325 (  0.1%)   0.0324 (  0.1%)  Demanded bits analysis #4
   0.0064 (  0.0%)   0.0260 (  0.7%)   0.0323 (  0.1%)   0.0323 (  0.1%)  Canonicalize natural loops #10
   0.0062 (  0.0%)   0.0260 (  0.7%)   0.0321 (  0.1%)   0.0322 (  0.1%)  Phi Values Analysis #4
   0.0063 (  0.0%)   0.0257 (  0.7%)   0.0320 (  0.1%)   0.0320 (  0.1%)  Basic Alias Analysis (stateless AA impl) #16
   0.0057 (  0.0%)   0.0261 (  0.7%)   0.0318 (  0.1%)   0.0317 (  0.1%)  Canonicalize natural loops #11
   0.0059 (  0.0%)   0.0260 (  0.7%)   0.0319 (  0.1%)   0.0317 (  0.1%)  MergedLoadStoreMotion #2
   0.0054 (  0.0%)   0.0261 (  0.7%)   0.0315 (  0.1%)   0.0315 (  0.1%)  Basic Alias Analysis (stateless AA impl) #21
   0.0049 (  0.0%)   0.0265 (  0.8%)   0.0314 (  0.1%)   0.0314 (  0.1%)  Loop-Closed SSA Form Pass #10
   0.0049 (  0.0%)   0.0259 (  0.7%)   0.0307 (  0.1%)   0.0308 (  0.1%)  Basic Alias Analysis (stateless AA impl) #17
   0.0048 (  0.0%)   0.0260 (  0.7%)   0.0308 (  0.1%)   0.0308 (  0.1%)  Basic Alias Analysis (stateless AA impl) #19
   0.0047 (  0.0%)   0.0261 (  0.7%)   0.0308 (  0.1%)   0.0308 (  0.1%)  Basic Alias Analysis (stateless AA impl) #20
   0.0046 (  0.0%)   0.0264 (  0.8%)   0.0310 (  0.1%)   0.0308 (  0.1%)  Lazy Branch Probability Analysis #25
   0.0050 (  0.0%)   0.0259 (  0.7%)   0.0309 (  0.1%)   0.0308 (  0.1%)  Memory Dependence Analysis
   0.0046 (  0.0%)   0.0262 (  0.7%)   0.0308 (  0.1%)   0.0307 (  0.1%)  Lazy Branch Probability Analysis #26
   0.0045 (  0.0%)   0.0260 (  0.7%)   0.0305 (  0.1%)   0.0307 (  0.1%)  Lazy Branch Probability Analysis #22
   0.0044 (  0.0%)   0.0261 (  0.7%)   0.0305 (  0.1%)   0.0304 (  0.1%)  Lazy Branch Probability Analysis #23
   0.0043 (  0.0%)   0.0262 (  0.7%)   0.0305 (  0.1%)   0.0303 (  0.1%)  Warn about non-applied transformations #2
   0.0043 (  0.0%)   0.0259 (  0.7%)   0.0302 (  0.1%)   0.0303 (  0.1%)  Lazy Branch Probability Analysis #20
   0.0041 (  0.0%)   0.0260 (  0.7%)   0.0301 (  0.1%)   0.0302 (  0.1%)  Lazy Branch Probability Analysis #21
   0.0041 (  0.0%)   0.0262 (  0.7%)   0.0303 (  0.1%)   0.0301 (  0.1%)  Loop Access Analysis #4
   0.0039 (  0.0%)   0.0261 (  0.7%)   0.0300 (  0.1%)   0.0301 (  0.1%)  Loop Distribution #2
   0.0042 (  0.0%)   0.0261 (  0.7%)   0.0302 (  0.1%)   0.0300 (  0.1%)  Lazy Branch Probability Analysis #24
   0.0041 (  0.0%)   0.0260 (  0.7%)   0.0301 (  0.1%)   0.0300 (  0.1%)  Phi Values Analysis #3
   0.0034 (  0.0%)   0.0265 (  0.8%)   0.0298 (  0.1%)   0.0298 (  0.1%)  Demanded bits analysis #3
   0.0037 (  0.0%)   0.0262 (  0.7%)   0.0298 (  0.1%)   0.0297 (  0.1%)  Loop Access Analysis #5
   0.0035 (  0.0%)   0.0263 (  0.8%)   0.0298 (  0.1%)   0.0297 (  0.1%)  Optimization Remark Emitter #23
   0.0033 (  0.0%)   0.0263 (  0.8%)   0.0296 (  0.1%)   0.0296 (  0.1%)  Optimization Remark Emitter #21
   0.0033 (  0.0%)   0.0262 (  0.8%)   0.0296 (  0.1%)   0.0295 (  0.1%)  Optimization Remark Emitter #20
   0.0034 (  0.0%)   0.0262 (  0.7%)   0.0295 (  0.1%)   0.0295 (  0.1%)  Alignment from assumptions #2
   0.0034 (  0.0%)   0.0262 (  0.7%)   0.0296 (  0.1%)   0.0295 (  0.1%)  Optimization Remark Emitter #24
   0.0030 (  0.0%)   0.0263 (  0.8%)   0.0293 (  0.1%)   0.0294 (  0.1%)  Optimization Remark Emitter #22
   0.0033 (  0.0%)   0.0261 (  0.7%)   0.0294 (  0.1%)   0.0294 (  0.1%)  Optimization Remark Emitter #19
   0.0032 (  0.0%)   0.0263 (  0.8%)   0.0295 (  0.1%)   0.0294 (  0.1%)  Optimization Remark Emitter #17
   0.0032 (  0.0%)   0.0262 (  0.7%)   0.0295 (  0.1%)   0.0293 (  0.1%)  Optimization Remark Emitter #18
   0.0033 (  0.0%)   0.0260 (  0.7%)   0.0293 (  0.1%)   0.0292 (  0.1%)  Lazy Block Frequency Analysis #21
   0.0032 (  0.0%)   0.0260 (  0.7%)   0.0292 (  0.1%)   0.0292 (  0.1%)  Lazy Block Frequency Analysis #22
   0.0032 (  0.0%)   0.0260 (  0.7%)   0.0292 (  0.1%)   0.0292 (  0.1%)  Lazy Block Frequency Analysis #25
   0.0032 (  0.0%)   0.0260 (  0.7%)   0.0292 (  0.1%)   0.0291 (  0.1%)  Lazy Block Frequency Analysis #26
   0.0028 (  0.0%)   0.0263 (  0.8%)   0.0291 (  0.1%)   0.0291 (  0.1%)  LCSSA Verifier #9
   0.0029 (  0.0%)   0.0262 (  0.7%)   0.0291 (  0.1%)   0.0290 (  0.1%)  LCSSA Verifier #10
   0.0029 (  0.0%)   0.0260 (  0.7%)   0.0289 (  0.1%)   0.0290 (  0.1%)  Lazy Block Frequency Analysis #24
   0.0029 (  0.0%)   0.0261 (  0.7%)   0.0290 (  0.1%)   0.0290 (  0.1%)  LCSSA Verifier #8
   0.0030 (  0.0%)   0.0259 (  0.7%)   0.0289 (  0.1%)   0.0289 (  0.1%)  Lazy Block Frequency Analysis #23
   0.0031 (  0.0%)   0.0260 (  0.7%)   0.0290 (  0.1%)   0.0289 (  0.1%)  Lazy Block Frequency Analysis #20
   0.0027 (  0.0%)   0.0248 (  0.7%)   0.0275 (  0.1%)   0.0275 (  0.1%)  Annotation Remarks #2
   0.0273 (  0.1%)   0.0001 (  0.0%)   0.0274 (  0.1%)   0.0274 (  0.1%)  Dead Argument Elimination #2
   0.0153 (  0.1%)   0.0109 (  0.3%)   0.0262 (  0.1%)   0.0262 (  0.1%)  Block Frequency Analysis #7
   0.0260 (  0.1%)   0.0002 (  0.0%)   0.0262 (  0.1%)   0.0262 (  0.1%)  Globals Alias Analysis #3
   0.0153 (  0.1%)   0.0110 (  0.3%)   0.0263 (  0.1%)   0.0254 (  0.1%)  Post-Dominator Tree Construction #7
   0.0156 (  0.1%)   0.0056 (  0.2%)   0.0212 (  0.1%)   0.0212 (  0.1%)  Unroll loops #3
   0.0076 (  0.0%)   0.0110 (  0.3%)   0.0186 (  0.1%)   0.0185 (  0.1%)  Natural Loop Information #14
   0.0173 (  0.1%)   0.0004 (  0.0%)   0.0177 (  0.1%)   0.0177 (  0.1%)  Branch Probability Analysis #7
   0.0113 (  0.1%)   0.0001 (  0.0%)   0.0114 (  0.0%)   0.0114 (  0.0%)  Merge Duplicate Global Constants #2
   0.0023 (  0.0%)   0.0057 (  0.2%)   0.0080 (  0.0%)   0.0080 (  0.0%)  Delete dead loops #2
   0.0062 (  0.0%)   0.0000 (  0.0%)   0.0063 (  0.0%)   0.0063 (  0.0%)  Internalize Global Symbols
   0.0039 (  0.0%)   0.0001 (  0.0%)   0.0040 (  0.0%)   0.0040 (  0.0%)  Deduce function attributes in RPO #2
   0.0025 (  0.0%)   0.0004 (  0.0%)   0.0028 (  0.0%)   0.0028 (  0.0%)  Block Frequency Analysis #8
   0.0023 (  0.0%)   0.0004 (  0.0%)   0.0027 (  0.0%)   0.0027 (  0.0%)  Post-Dominator Tree Construction #8
   0.0016 (  0.0%)   0.0007 (  0.0%)   0.0023 (  0.0%)   0.0023 (  0.0%)  Dominator Tree Construction #9
   0.0012 (  0.0%)   0.0004 (  0.0%)   0.0016 (  0.0%)   0.0016 (  0.0%)  Natural Loop Information #16
   0.0012 (  0.0%)   0.0000 (  0.0%)   0.0012 (  0.0%)   0.0012 (  0.0%)  Eliminate Available Externally Globals #2
   0.0000 (  0.0%)   0.0002 (  0.0%)   0.0002 (  0.0%)   0.0009 (  0.0%)  Whole program devirtualization
   0.0006 (  0.0%)   0.0000 (  0.0%)   0.0006 (  0.0%)   0.0006 (  0.0%)  Assumption Cache Tracker #2
   0.0005 (  0.0%)   0.0000 (  0.0%)   0.0005 (  0.0%)   0.0005 (  0.0%)  Infer set function attributes #2
   0.0000 (  0.0%)   0.0000 (  0.0%)   0.0000 (  0.0%)   0.0000 (  0.0%)  Lower type metadata #2
   0.0000 (  0.0%)   0.0000 (  0.0%)   0.0000 (  0.0%)   0.0000 (  0.0%)  Lower type metadata
   0.0000 (  0.0%)   0.0000 (  0.0%)   0.0000 (  0.0%)   0.0000 (  0.0%)  Cross-DSO CFI
   0.0000 (  0.0%)   0.0000 (  0.0%)   0.0000 (  0.0%)   0.0000 (  0.0%)  Global splitter
   0.0000 (  0.0%)   0.0000 (  0.0%)   0.0000 (  0.0%)   0.0000 (  0.0%)  Force set function attributes #2
   0.0000 (  0.0%)   0.0000 (  0.0%)   0.0000 (  0.0%)   0.0000 (  0.0%)  Scoped NoAlias Alias Analysis #2
   0.0000 (  0.0%)   0.0000 (  0.0%)   0.0000 (  0.0%)   0.0000 (  0.0%)  Profile summary info #2
   0.0000 (  0.0%)   0.0000 (  0.0%)   0.0000 (  0.0%)   0.0000 (  0.0%)  Target Transform Information #2
   0.0000 (  0.0%)   0.0000 (  0.0%)   0.0000 (  0.0%)   0.0000 (  0.0%)  Type-Based Alias Analysis #2
   0.0000 (  0.0%)   0.0000 (  0.0%)   0.0000 (  0.0%)   0.0000 (  0.0%)  Target Library Information #2
  19.3446 (100.0%)   3.4961 (100.0%)  22.8407 (100.0%)  22.7992 (100.0%)  Total
代码量统计
kotlin构建有两个gradle任务,首先 compileKotlin 任务接一批kt文件,输出针对某一target的klib,之后 link 任务接一批klib输入,输出最终的pod/so。准确的统计kt代码量有两点困难
- kt文件中不光是代码,还有注释空行等,不应该简单认为行数就是代码量
- 最终进到so的产物中部分,甚至可能大部分都是klib,本地不一定有对应的源码